The Hidden Side of Math
I have always enjoyed math in school because of its straightforwardness and logic. After learning a new concept or equation, all you must do is practice applying the new rules you know given different information, or practice the same steps for different values. Once you understand the concept, you can take that knowledge and apply it to any problem in that area of math and be able to hold your own.
I just finished taking a Mathematical Impossibilities course at UNM. In this course, we explored the not-so-straightforward aspects of math. We have delved into math ideas that have no answer, or infinitely many answers, or ideas that are so obscure, we still don’t know the answers. We have thought about math creatively, philosophically, historically. We have explored the ways math isn’t logical, the problems it cannot answer. I have fallen even more in love with math because I have learned that all the reasons I loved it before are wrong. Math isn’t what I thought it was. It’s more.
It’s kind of sad to me that, although everyone needs to take math courses in their academic careers, very few will ever learn about the things we’ve learned in this course. In an attempt to spread the word of math’s greatness, I will illustrate some of my favorite ways math interacts with the world. I’m hoping that by showing how math isn’t independent--that it’s interdisciplinary and affects us all--I will teach someone else what I have learned in this course.
1. Fractals: Math and Nature
Math and nature were opposite concepts to me. I, like most of the world, thought that natural couldn’t be mathematical, they’re organic and don’t play by the steadfast rules math does. As it turns out, math doesn’t play by rules, either.
The google definition of a fractal is as clear an example as any of the ways math and nature interact.
Fractal - (n.) a curve or geometric figure, each part of
which has the same statistical character as the whole.
 Fractals are useful in modeling structures (such as eroded coastlines or snowflakes) in which similar patterns recur at progressively smaller scales, and in describing partly random or chaotic phenomena such as crystal growth, fluid turbulence, and galaxy formation.
 I find it helpful that the only examples the definition above gives are natural ones--making the whole concept a lot more digestible or familiar.
In mathematical terms, a fractal is a figure that is self-similar, where it’s whole looks the same as a part of it. In some cases, they are infinitely self-similar (you could keep zooming in and it wouldn’t end).
 A geometric fractal is one where a shape that is geometrically similar to the whole is added to the whole. The Koch Snowflake, pictured on the right, is a geometric fractal made by adding smaller triangles to the edges of a larger triangle and repeating that as many times as you want or can--even an infinite number of times.
An algebraic fractal is one that can be described using an algebraic equation and can be plotted on a regular coordinate plane. The Mandelbrot Set is a set of fractals that can be described using the quadratic recurrence equation:

This equation simply says to obtain a new value, all you must do is square the old value and add a constant. So, you can take any fractal in the Mandelbrot Set and continue adding to it by following the steps in that equation. 
This fractal is one in the Mandelbrot Set. There’s a video on YouTube that claims to be the “Deepest Mandelbrot Set Zoom Animation Ever” and it lasts for over five minutes (https://www.youtube.com/watch?v=0jGaio87u3A). To me, the coolest part about this fractal is that if you change your focal point (change where exactly you’re zooming into) the whole picture changes. And then, all of a sudden, the original shape you see in the image above returns again. It ends up being fractals within a fractal that you explore simply by zooming in on one point.
2. Math and Music
There are many ways math relates to music. My favorite way is the relationship between the sine waves of the frequencies of pitches and consonance. Let me explain all that.
There’s an equation that we can use to graph the sine wave of any pitch: y(t)=sin(2πft).
In this equation, f represents the frequency of the pitch you want to graph and t is time for which the pitch sounds. Pitches that sound really good together (or are consonant) have sine waves that meet each other on the axis of this graph. Pitches that sound not so good together (or are dissonant) have sine waves that rarely or never meet on the axis.
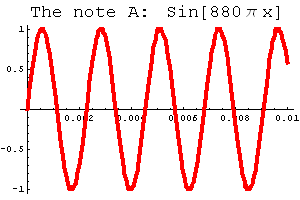 The frequencies of the pitches of consonant pitches will have sine waves that, when all graphed on the same graph, will meet each other on the axis. The graph to the right is one of the note A. If we were to put the graphs of notes that sound good with A (such as F# and D to complete a major triad), the sine waves of these pitches will meet each other at least once at the axis. The sine waves of dissonant notes (the ones that don't sound good together), rarely or never meet each other on the axis.
There’s a theory that Beethoven was able to compose music even after he lost his hearing because he could ‘see’ the sine waves of the pitches he was playing and knew how they interacted with each other. I don’t know if he knew about the equation we used or about sine waves in general, but the theory is that he knew how each pitch sounded visually and was able to play with consonance and dissonance that way.
3. Chaos Theory and How it Relates
Chaos theory is something I didn’t even know existed until this course. It is a branch of mathematics that deals with complex systems whose behavior is very sensitive to small alterations and isn’t predictable on large scales. You can only derive the next value if you know the value that came right before it.
Chaos theory relates to weather forecasting pretty strongly. In the 1960s a meteorologist named Ed Lorenz was creating computer models of weather patterns and found that by inputting almost immeasurably small changes in his computer, the long-term weather patterns significantly changed. This is what brings us the ‘butterfly effect’--the notion that one small thing (like the flap of a butterfly’s wings) can eventually cause a really big thing (like a hurricane on the other side of the world). That’s why we can only predict weather 7-10 days in advance; any further predictions would be unreliable. And even the predictions we can make are still always subject to change. It’s impossible for us to know what the weather will be like in a month because that depends too greatly on how the weather turns out in three weeks.
In biology, chaos theory is often used in species population models. Things like natural disasters, droughts or unusual spikes in predator populations can cause the population of a certain animal to drop quickly. We can’t predict when those things will happen so we can’t predict what the population will be after they do. In order to find an unknown value (like the population in 50 years) we need to know the value right before our unknown (like the population in 25 years), otherwise our prediction is awfully unreliable.
In economics, small changes are often translated to bigger results later on. As technology advances further and global communication gets easier, changes in the economy of one area of the world has enormous effects on the economies of other areas. China is currently America’s largest trading partner. If something caused China to put a halt to the production of our favorite electronic devices, not only would China’s economy shift, but ours would greatly change, too. We’d have to find someone else to make our phones, or possibly start making them ourselves, or find other ways to entertain ourselves. Our whole lives would change.
A Final Farewell
Although we covered so many more topics in this course, these were the ones that intrigued me the most because they show the complexities and diversity of math. The biggest thing I gained from this course was a broader perspective about math and how we can use it to make sense of the world. Sometimes we can’t make sense of any of it. Sometimes how someone else has explained it makes no sense to us. I still don’t fully understand a lot of what we discussed, and maybe I never will. But I want to, and that’s what matters to me. No other math course has made me want to continue to learn, made me want to dive further than required into a subject because it’s just that cool. Even if math ends up having nothing to do with my career, I hope I never lose this new passion for it.